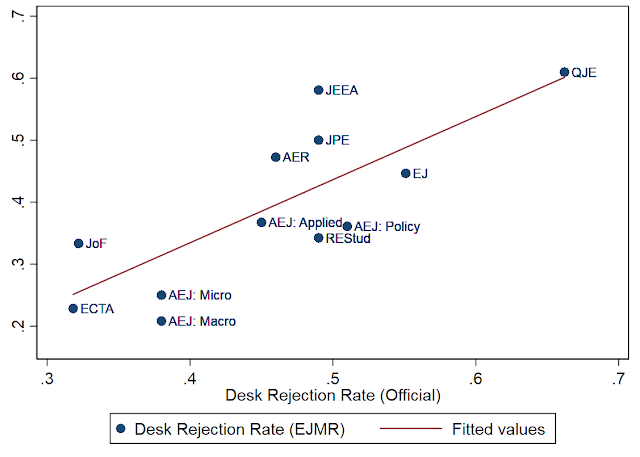
Overall, the data line up fairly well.
Here is the correlation in journal first-response times, conditional on being sent out for review. The R-squared is a respectable .52, although AEJ: Micro is an outlier on EJMR, where it actually does better than what the official statistics suggest (with N=16 though...). Author-reported weight times are about two weeks longer on average, but on ejmr, you round to the nearest month vs. day, so some difference isn't surprising.
Here is the correlation between desk rejections, author vs. journal reported. The regression coefficient is close to 1, and the R-squared is .63. The intercept is -.072, as average reported desk-rejections are lower on ejmr.
Here's the Data:
| Journal | Desk Reject Rate (EJMR) | Desk Reject (Official) | First Response Time, Conditional on Being Sent Out to Referees (EJMR) | First Response Time, Conditional on Being Sent Out to Referees (Official) |
| QJE | 61% | 66% | 1.5 | 1.5 |
| JPE | 50% | 49% | 8.0 | 4.0 |
| REStud | 34% | 49% | 4.5 | 3.4 |
| ECTA | 23% | 32% | 3.6 | 3.4 |
| AEJ: Macro | 21% | 38% | 2.9 | 3.4 |
| AEJ: Applied | 37% | 45% | 2.5 | 2.7 |
| Journal of Finance | 33% | 32% | 3.0 | 2.2 |
| AER | 47% | 46% | 3.7 | 3.1 |
| JEEA | 58% | 49% | 2.5 | 3.2 |
| AEJ: Policy | 36% | 51% | 2.8 | 3.1 |
| EJ | 45% | 55% | 3.7 | 3.6 |
| AEJ: Micro | 25% | 38% | 3.4 | 4.5 |


No comments:
Post a Comment
Note: Only a member of this blog may post a comment.